Nowadays, when user attention spans are fleeting, a website’s performance can make or break its success. A seamless and swift online experience not only captivates visitors but also plays a pivotal role in search engine rankings and overall user satisfaction. That’s why this article is here to help you explore the domain of website performance monitoring tools, ensuring your digital presence is at its prime, working relentlessly in the background.
At this point, some may ask: “If I have Googe PageSpeed Insights and other instruments for monitoring Core Web Vitals, why would I need other tools?”
Well, Core Web Vitals are really important, but they are unlikely to help when it comes to your server being down or extremely slow in certain locations, not to mention the cases when your website has found itself in a somewhat mismatched duel with a computer virus.
Long story short, tools like PageSpeed Insights or GTmetrix are made for checking a website occasionally. In contrast, the performance monitoring tools I will talk about in this article are made for sustainable and constant monitoring and getting full information about what’s going on not only on your websites but on the server, be it cloud, VPS, or dedicated ones. When an agency or a freelancer manages many sites, comprehensive performance monitoring tools are an absolute must-have.
Table of Contents
Understanding Performance Monitoring Terms
This article is mostly for those who run WordPress websites, which can be big or small, and use shared hosting or dedicated servers. There are plenty of tools and approaches that are available for servers, infrastructure, or just website monitoring. But to understand what exactly you need as an agency, website owner, or freelancer, let’s get through the terms and acronyms used when it comes to IT monitoring.
WPA (Web Performance Analytics)
Web Performance Analytics involves analyzing and measuring various aspects of a website’s performance, including page load times, user interactions, and overall user experience. WPA provides insights into the overall performance of a website, helping organizations understand how users engage with the site and identifying areas for improvement in terms of speed and usability.
RUM (Real User Monitoring)
Real User Monitoring involves tracking and analyzing the actual interactions of users with a website or application. It captures real-time data on user behavior, including page views, load times, and interactions.
Use case: RUM provides insights into how real users experience and interact with a website or application, helping identify performance issues from the user’s perspective.
Synthetic Monitoring
Synthetic Monitoring involves simulating user interactions with a website or application through automated scripts. These scripts mimic typical user journeys and transactions to monitor performance under controlled conditions. Synthetic Monitoring helps proactively identify and address potential issues by simulating user interactions, allowing organizations to ensure the reliability and performance of their applications.
DPM (Database Performance Monitoring) or DPA (Database Performance Analyzing)
Database Performance Monitoring focuses specifically on monitoring the performance of database systems. It includes tracking metrics such as query execution times, resource utilization, and overall database responsiveness. DPM helps database administrators optimize database performance, identify inefficient queries, and ensure the efficient operation of database systems.
APM (Application Performance Monitoring)
Application Performance Monitoring is centered around monitoring and optimizing the performance of software applications. It involves tracking metrics related to code execution, database queries, external service calls, and overall application behavior. APM helps developers and IT teams understand how an application is performing, pinpoint performance bottlenecks, and optimize code for better user experiences.
IPM (Infrastructure Performance Monitoring)
Infrastructure Performance Monitoring focuses on monitoring the health, performance, and availability of the underlying infrastructure components that support applications. This includes servers, databases, networking equipment, and other hardware. IPM helps identify bottlenecks or issues within the infrastructure that could impact the performance of applications.
ITIM (IT Infrastructure Monitoring)
IT Infrastructure Monitoring encompasses a broader scope than Infrastructure Performance Monitoring. It involves monitoring the entire IT infrastructure, including both hardware and software components. This may include servers, networks, applications, and services.
Use сase: ITIM provides a holistic view of the entire IT environment, helping organizations ensure the reliability and performance of their overall IT infrastructure.
Sematext (Premium with Freemium Tools)
🏆 Best for full-stack monitoring.
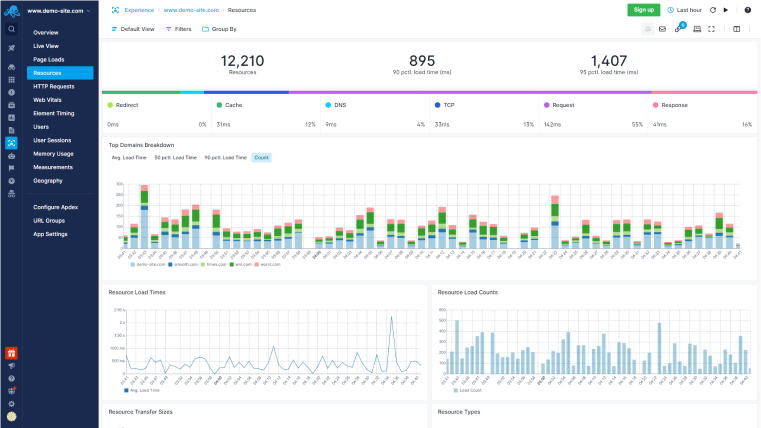
This service is a great asset both for seasoned DevOps and casual site curators because it offers a wide range of tools, from website performance checkups to monitoring a big server infrastructure.
Key features/products:
- cloud monitoring;
- infrastructure monitoring;
- log management;
- real user monitoring;
- synthetic monitoring;
- APM / tracing.
G2 rating: 4.7 out of 5.
Pros:
- a lot of features behind each of the products;
- powerful log management;
- easy-to-use dashboard;
- comprehensive real-user monitoring (for websites);
- a basic (free) plan with limited log, infrastructure, and service monitoring;
- unlimited sources and users in all plans;
- flexible pricing.
Cons: it can be a bit pricy, but it depends on the products purchased.
Pricing: depends on the products and data retention period; the cheapest plan is $45/month. A limited free Basic plan is available.
What does it offer for WordPress website monitoring on shared hosting?
There are two tools for non-DevOps:
- Experience monitoring with comprehensive reports about speed, requests, Web Vitals, etc. The price starts at $9/month.
- Synthetic monitoring to test websites and APIs and emulate activity. The price is $2/per monitor per month.
Atatus (Premium)
🏆 Best for website and application monitoring.
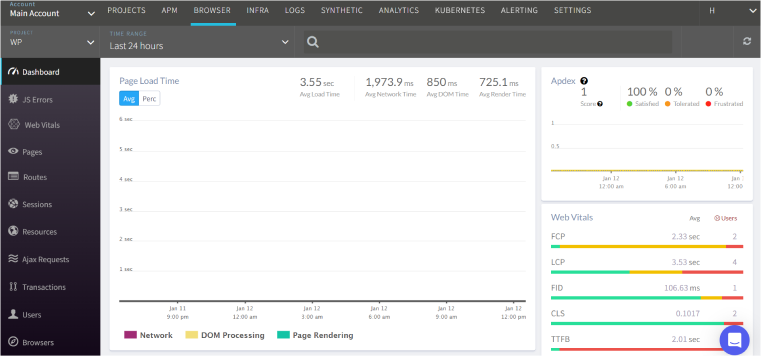
This SaaS tool is very similar to the previous one, but it’s more focused on Application Performance Monitoring (APM), Real User Monitoring (RUM), and Error Tracking.
Key features:
- application performance monitoring (APM);
- real user monitoring (RUM);
- infrastructure monitoring;
- logs monitoring;
- uptime monitoring;
- API analytics;
- error tracking.
G2 rating: 4.7 out of 5.
Pros:
- intuitive interface;
- unlimited team members;
- quite easy to install with clear instructions;
- very detailed reports;
- a lot of tools;
- value for money.
Cons: the “pay-as-you-go” pricing model can be a bit confusing for new users.
Pricing: each service has its own price per corresponding unit, and you pay monthly for what you have used.
What does it offer for WordPress website monitoring on shared hosting?
You can use the Browser tool for RUM and Synthetic monitoring. To do it, add a JavaScript app to the dashboard and the tracking code to the site’s header.
Uptime (Premium with free tools)
🏆 Best for website availability and performance monitoring.

Uptime.com makes what its name suggests and much more. It’s a great tool for both seasoned website developers and beginners.
Key features:
- uptime monitoring;
- real user monitoring (RUM);
- transaction checks;
- API monitoring;
- synthetic monitoring;
- public status pages with historical records;
- global external monitoring.
G2 rating: 4.5 out of 5.
Pros:
- you can add HTML focus elements and steps for checking them in a frame of the PageSpeed tool;
- private monitoring locations;
- easy-to-use interface and flexible test settings;
- very easy to install.
Cons: the free tools give only basic information.
Pricing: has free tools with limited functionality. The premium plan starts at $20/month. To get access to most of the features, you will need a $80/month subscription.
New Relic (Premium with free tools)
🏆 Best for experienced DevOps and full-stack monitoring.
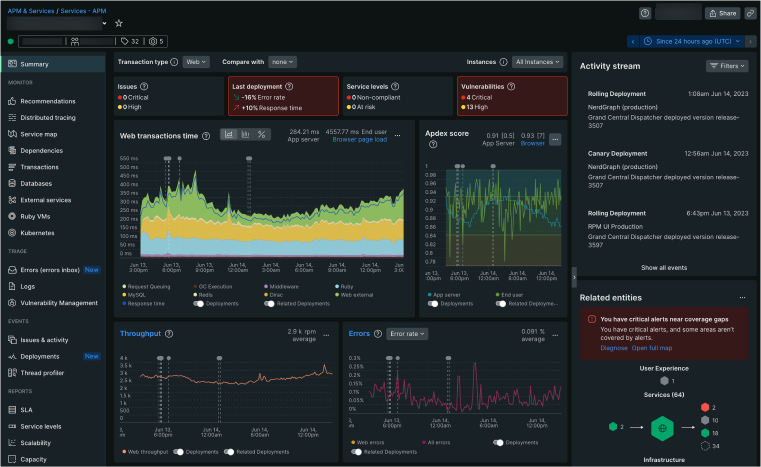
This is one of the oldest application monitoring tools on the market since 2006, and it’s one of the reasons for its popularity.
Key features/products:
- a powerful log management;
- detailed application performance monitoring (APM);
- real user monitoring (RUM);
- infrastructure monitoring;
- database monitoring.
Pros:
- distributed tracing with graph view;
- integrated with many DevOps tools;
- flexible dashboards and the ability to prioritize certain graphics;
- free plan.
Cons:
- it can become expensive after the free quota is over;
- you pay for each team member;
- according to many customers’ reviews, the support is bad;
- application’s UI is not very user-friendly;
- no easy-to-install tools, such as RUM (all tools are available only after setting up a PHP app at your hosting).
Pricing: 100 GB of free data ingested per month and $0.30/GB ingested beyond.
What does it offer for WordPress website monitoring on shared hosting?
It has good tools, but installing it can be tricky, and not every shared hosting provider supports it because you have to install and set up a PHP app (using a CLI interface).
SpeedVitals (Freemium)
🏆 Best for beginners and simple testing.
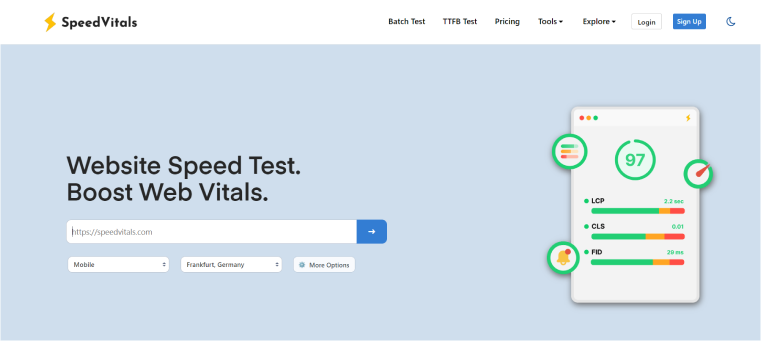
This tool does three things: checks Web Vitals, CDN performance, and TTFB. This tool is quite new, so there are more things to come according to the roadmap. The service can be called free because its free plan is quite functional and just has certain limitations on the number of checkups; however, in many cases, it’s enough for one site.
Key features:
- straightforward interface;
- useful tools;
- variety of locations to test websites from.
Pros:
- batch test tool with multiple locations, URLs, or devices is very convenient;
- Core Web Vitals tests come with quite detailed reports;
- suggestions on how to fix things;
- a free plan is fully functional.
Cons:
- a limited number of tools and locations;
- paid plans are a bit costly for what they offer.
Pricing: free; the paid plans start at $20/month per 1 website. TTFB monitoring (not occasional tests) is available only in paid plans.
WebPageTest by Catchpoint (Free)
🏆 Best for tracking website performance and its changes.
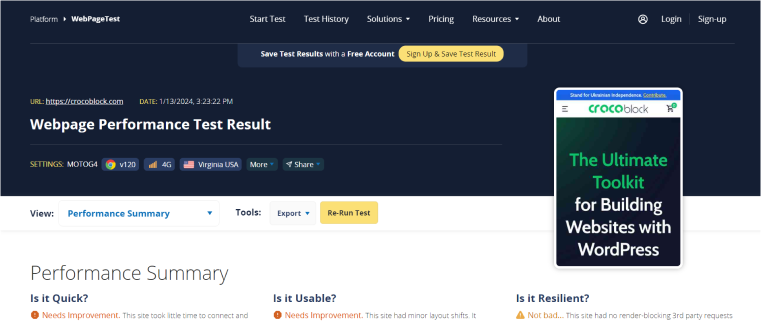
WebPageTest.org (WPT) is a free tool that offers a comprehensive website performance analysis and shows opportunities and tips.
Its parent company, Catchpoint, is a digital experience monitoring (DEM) platform. Catchpoint provides tools and services that allow organizations to monitor and analyze the performance and availability of their websites, applications, and online services from various locations around the world.
But here, we will talk about the WebPageTest tool because this is what we need to monitor websites.
Key features:
- comprehensive reports about performance and optimization opportunities;
- a traceroute tool;
- experiments are available in the Pro version.
Pros:
- a very detailed report;
- 15 types of report views to see every little detail;
- a 30-day history of checkups is available;
- tips on website optimization;
- a lot of visualizations (graphs) of the processes.
Cons: not detected.
Pricing: a free plan with 300 tests/month. The Pro plan starts at $18.75 a month for 1000 runs, experiments, private tests, and some other perks.
Pingdom by SolarWinds (Freemium)
🏆 Best for beginners and small to middle-sized websites.
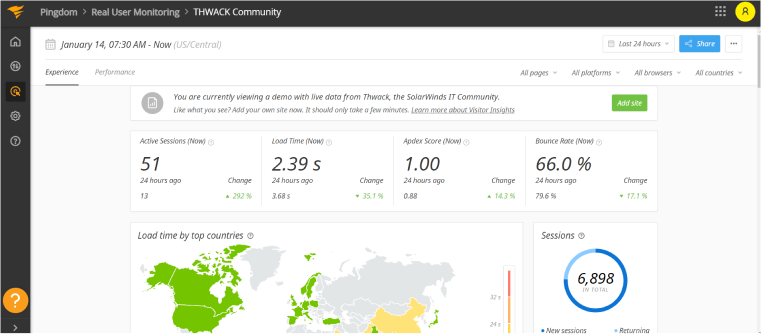
Pingdom is quite a famous tool because it has limited free functionality for fast site checkups. It doesn’t use Google Lighthouse and has its own metrics. It’s a part of the SolarWinds platform.
Key features:
- real user monitoring (RUM);
- transaction checks;
- API monitoring;
- synthetic monitoring;
- public status pages.
G2 rating: 4.0 out of 5.
Pros:
- it has a free limited version;
- a 30-day free trial;
- easy to use.
Cons:
- no Core Web Vitals reports;
- overall, not very detailed reports and not so many tools;
- AMP and other tools are available under another set of SolarWinds products;
- very expensive for what it offers, with usage limits.
Pricing: free limited version; the premium one has a progressive pricing model, where Synthetic monitoring and RUM are counted separately. The cheapest plan will cost you $30/month, but there are a limited number of checks, and if you want more, the price can double.
GTmetrix (Freemium)
🏆 Best for basic website tests.
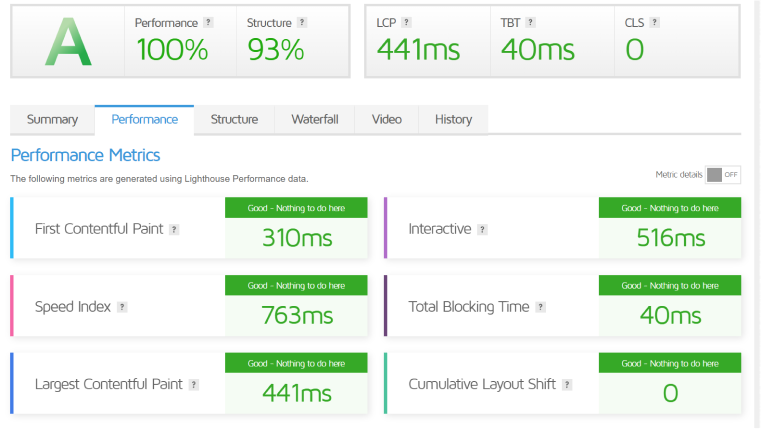
This tool is well-known thanks to its free perks. It checks a website’s performance based on the Google Lighthouse tool, with handy waterfall charts and historical data.
Key features:
- performance grades and Web Vitals;
- handy charts;
- saves history even in a free plan.
Pros:
- it is basically a free tool, so you pay if you need more testing slots, locations, longer retention history, or team seats;
- it has a WordPress plugin to connect the service with API code, which is very beginner-friendly;
- the pricing is flexible and cheap.
Cons:
- the reports are quite basic;
- not many testing locations to choose from, even on higher plans.
Pricing: starts at $5/month.
Intruder (Premium)
🏆 Best for detecting vulnerabilities of web apps and networks.
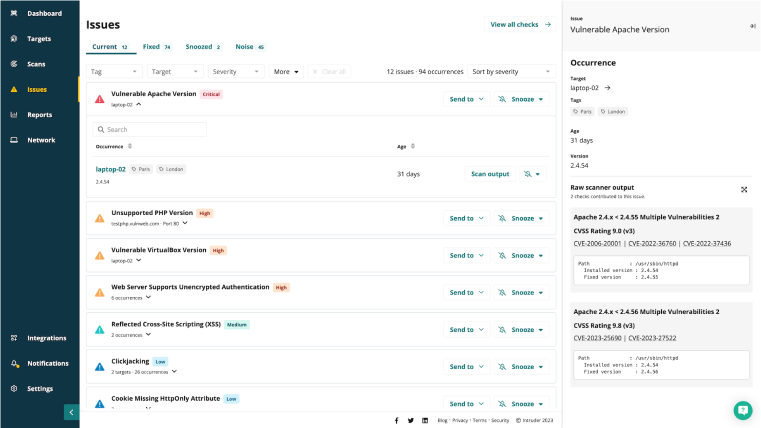
Intruder is a cybersecurity tool that provides a cloud-based vulnerability scanning service. It is designed to help businesses and organizations identify and manage potential security risks within their digital infrastructure.
Key features:
- attack surface monitoring;
- vulnerability monitor;
- cloud, internal, and external systems scanning.
G2 rating: 4.8 out of 5.
Pros:
- easy-to-use UI;
- scalable;
- various tools.
Cons:
- 30-day lock on moving authentication domain targets;
- a trial requires a credit card;
- not very detailed reports.
Pricing: starting at $200 a month.
Wappalyzer (Freemium)
🏆 Best for getting new ideas and monitoring competitors.
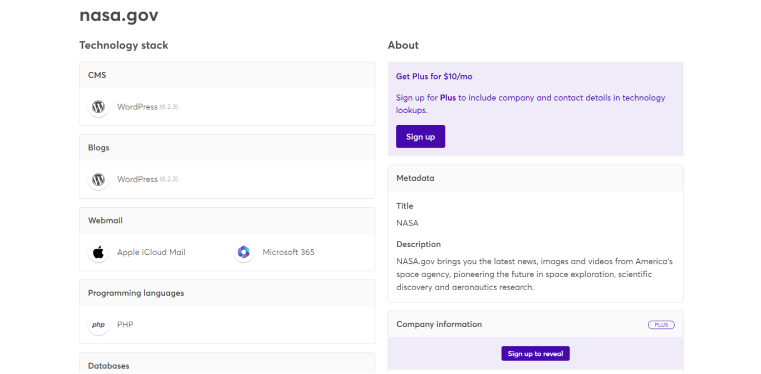
This tool is not actually about performance monitoring but can be quite useful. It lets you have a look at the technology stack of other websites, which can be useful to discover new trends and take ideas from competitors, market research, or data enrichment.
Key features:
- technology lookup;
- email verification;
- lead lists;
- monitoring websites for technology changes.
G2 rating: 4.8 out of 5.
Pros:
- a lot of integrations, from browser extensions to CRMs and automation services;
- great customer support.
Cons:
- expensive after using a monthly quota of 50 lookups;
- CRM integration and API credits are available only on higher plans.
Pricing: a free version has a limit of 50 lookups a month; a Pro version starts at $250/month.
FAQ
Website monitoring is the process of testing and verifying that end users can interact with a website or web application as expected. The monitoring tools also send notifications if something goes wrong.
Well, it’s not so cool if your clients tell you that the site is not working properly or if you realize that you’ve lost hundreds of clients from your paid campaign because the website didn’t work fast or well enough, right?
Just check the list of tools in this article for continuous monitoring.
Takeaway
In this article, we talked about both simple and complex monitoring tools that ensure your project is afloat and works properly, delivering the best user experience to the clients. You can choose the most suitable for you and have a good night’s sleep, knowing that your digital infrastructure is under control and you will get alerts if something happens.