Running a WooCommerce store means you’ll spend a lot of time ⏲️ staring at numbers. You’ll need to keep an eye on sales, inventory, returns, taxes, and many other things. The built-in WooCommerce analytics functionality provides a collection of all important data, making it easier to monitor your store. However, you’ll want to prioritize the most essential metrics.
If you know what metrics to pay attention to, you’ll be able to spot issues with your store before they become full-blown problems. It will also help you recognize trends and patterns in purchasing behavior, and plan your marketing strategy accordingly.
In this article, we’ll discuss eight key built-in WooCommerce analytics metrics you need to follow and show you how to monitor them. Let’s get to it!
📚 Table of contents:
- Total, Net, and Gross Sales
- Orders and Items Sold
- Average Order Value and Items per Order
- Product Returns
- Shipping Costs
- Taxes
- Top Categories and Products
- Discounted Orders and Discount Amount
1. Total, Net, and Gross Sales
Understanding the difference between total, net, and gross sales is essential to any business, not just online stores. Before we show you where to access these WooCommerce analytics metrics, let’s talk about the differences between all three:
- Total sales: This refers to the sum of all transactions in a specific time period, including the value of products, services, taxes, shipping fees, and any other charges associated with the sale. This figure represents the total revenue generated by the store before accounting for refunds, discounts, or any other fees.
- Net sales: Net sales refer to the revenue generated by the store after accounting for refunds, returns, and discounts. This value provides a more accurate representation of the actual income earned by the store.
- Gross sales: With gross sales, you get the total revenue generated from the sale of goods and services, excluding taxes, shipping fees, and other charges. In WooCommerce, gross sales can be calculated by subtracting taxes, shipping fees, and other charges from the total sales figure.
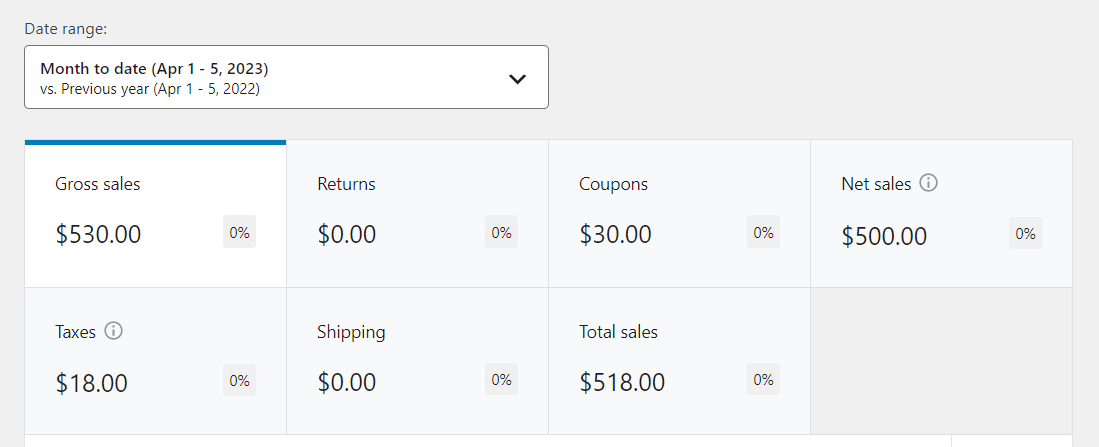
Total sales is the figure that you’ll probably pay attention to the most. You can access this metric by navigating to Analytics → Revenue in your WordPress dashboard.
Here, you can see total, net, and gross sales, as well as other important figures:
💡 Keep in mind that WooCommerce also enables you to download this data in .csv format. You can do this by scrolling past the revenue breakdown and clicking on the Download button.
2. Orders and Items Sold
When running a WooCommerce store, you’ll probably want to be notified every time a purchase has been made. You can configure WooCommerce to send you notifications for products sold or access WooCommerce analytics to monitor your orders.
Although both metrics sound similar, they represent different things:
- Orders. An order in WooCommerce represents a single transaction made by a customer on your online store. When a customer adds items to their cart and proceeds to checkout, they create an order. Any given order can include one or multiple products.
- Items sold: This metric refers to the total number of individual items or units purchased by customers in a specific time period. It is an essential metric for understanding sales volume which can help you identify trends, popular products, and inventory requirements.
You can access these metrics by navigating to Analytics > Products. You’ll see an overview of items sold and total orders at the top of the screen, alongside your store’s net sales:

If you scroll down to the Products lists, you’ll see all the individual products included in each sale. This data is essential as it enables you to spot trends in purchasing behavior, see what products customers prefer, and identify underperforming items.
3. Average Order Value and Items per Order
Ideally, you’ll want every order to be a big one. This means having customers who either buy expensive products or purchase multiple items at the same time.
Average order value and items per order are two important WooCommerce analytics metrics that help you keep an eye on your orders. Here’s what they represent:
- Average order value. This is the average amount of money a customer spends on a single order in your online store. This number is calculated by dividing the total revenue (usually net sales) by the total number of orders in a specific time period.
- Average items per order. This is the average number of products purchased in a single order by customers. It is calculated by dividing the total number of products sold by the total number of orders in a specific time period.
You can access these metrics by navigating to Analytics > Orders in the dashboard. The values appear alongside the total number of orders and net sales for the store:

Increasing the average items per order should lead to a higher average order value and net sale numbers. There are a lot of ways to increase these metrics, such as by implementing upsells and cross-sells, offering free shipping for orders above a specific value, and more.
4. Product Returns
As far as WooCommerce analytics metrics go, this one is fairly straightforward. Any successful online store will have a fair share of returns – that’s just how the business works. However, your goal should be to minimize returns as much as possible.
To look at this metric, go to Analytics > Revenue. You’ll find the numbers associated with returns next to gross sales:

On average, returns for online stores tend to be fairly high. Some studies show figures up to 10-16 percent of all sales and these numbers go up during particularly busy shopping seasons [1].
Your goal when monitoring this metric is to look for spikes in the percentage of returns. If the numbers rise, you might have a problem with your products or the store might not be offering adequate post-sales support.
5. Shipping Costs
Shipping is one of the most essential aspects of any online store. Fast, efficient, and cost-effective shipping can make or break a store.
If you’re paying too much for shipping, it can eat into net sales. However, you don’t want to skimp on it, either. It’s important to ensure that customers get the best possible experience.
You can monitor your shipping costs by going to Analytics > Revenue. Here, you’ll find an overview of shipping costs next to your store’s total sales numbers:

Most customers expect to pay as little as possible while still getting blazing-fast deliveries. In fact, up to 62 percent of shoppers expect free deliveries in three days or fewer [2].
Monitoring this metric 🖥️ is essential for understanding other parts of the customer experience. For example, if you see returns go up or sales go down while shipping costs go up, those increased fees might be what’s putting customers off.
6. Taxes
Taxes are perhaps the most daunting thing about running a business. However, if you don’t monitor how much money is going into WooCommerce taxes, you’ll likely have a terrible time when submitting your tax returns.
You can monitor how much money you’re collecting from taxes by going to Revenue > Taxes in WooCommerce:

To get a fuller picture of your store’s taxes, navigate to Analytics > Taxes. Here, you can see total tax costs, order taxes, and shipping taxes:

From time to time, you’ll want to check these tax metrics to make sure that you’re charging the right rates. It’s also a good idea that you forward this data to your accountant.
7. Top Categories and Products
Any store is going to have bestselling items, but these might change over time. To check out your most popular products, go to Analytics > Overview and scroll to the bottom of the screen:

With this information at your disposal, you can focus on optimizing the sales experience for your bestselling products. For example, you might offer free shipping on hot products to encourage more sales.
Alternatively, you might consider offering discounts on categories or products that aren’t performing so well. This can help you move inventory that would otherwise sit stale.
8. Discounted Orders and Discount Amount
Offering discount coupons and running sales are two effective ways to boost profit. You can use these strategies to shore up sales during slow months, get rid of excess stock, and build customer loyalty.
To reap the full benefits of discounts, you’ll need to monitor how customers react to them. This means checking to see how many orders with discounts are made, and how much they’re costing you.
To access these numbers, go to the Analytics > Coupons screen:

The number of discounted orders within a specific period should provide some insights into your coupon campaigns. You can use that data to compare campaign tactics and see what are the approaches that your customers prefer.
Start analyzing WooCommerce analytics today 🎯
WooCommerce gives you access to a lot of data on your store’s performance. With WooCommerce analytics, you can see what products your customers prefer, what discount campaigns work best, the number of returns made, and much more.
Analytics tools 📉 tend to drown you in information. Therefore, it’s vital that you know what metrics are the most important so you can monitor your store more efficiently. For example, you’ll want to keep a close eye on your net sales, returns, shipping costs, top products, and discounted orders.
👉 If you want to dig even deeper, you can also set up Enhanced Ecommerce Tracking in Google Analytics. That will let you view WooCommerce analytics data from inside your Google Analytics dashboard.
Do you have any questions about WooCommerce analytics? Let us know in the comments section below!